Where to Find Campaign Performance Data
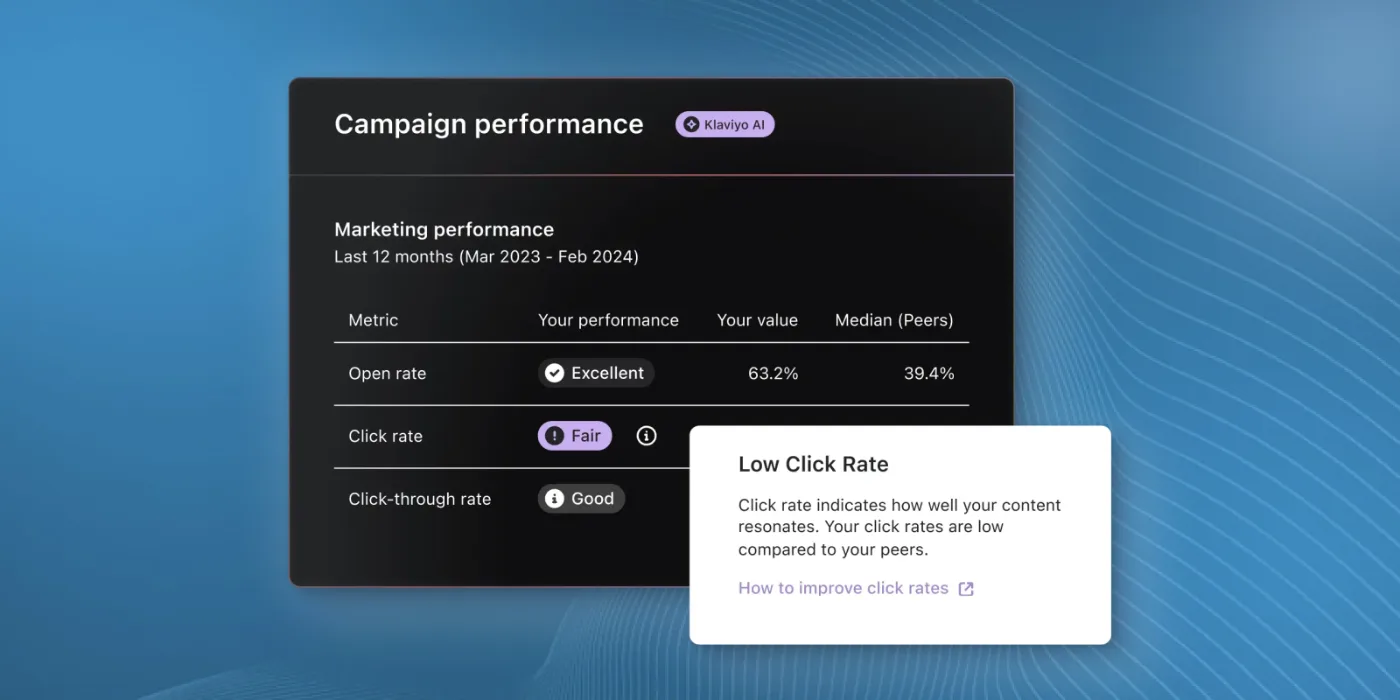
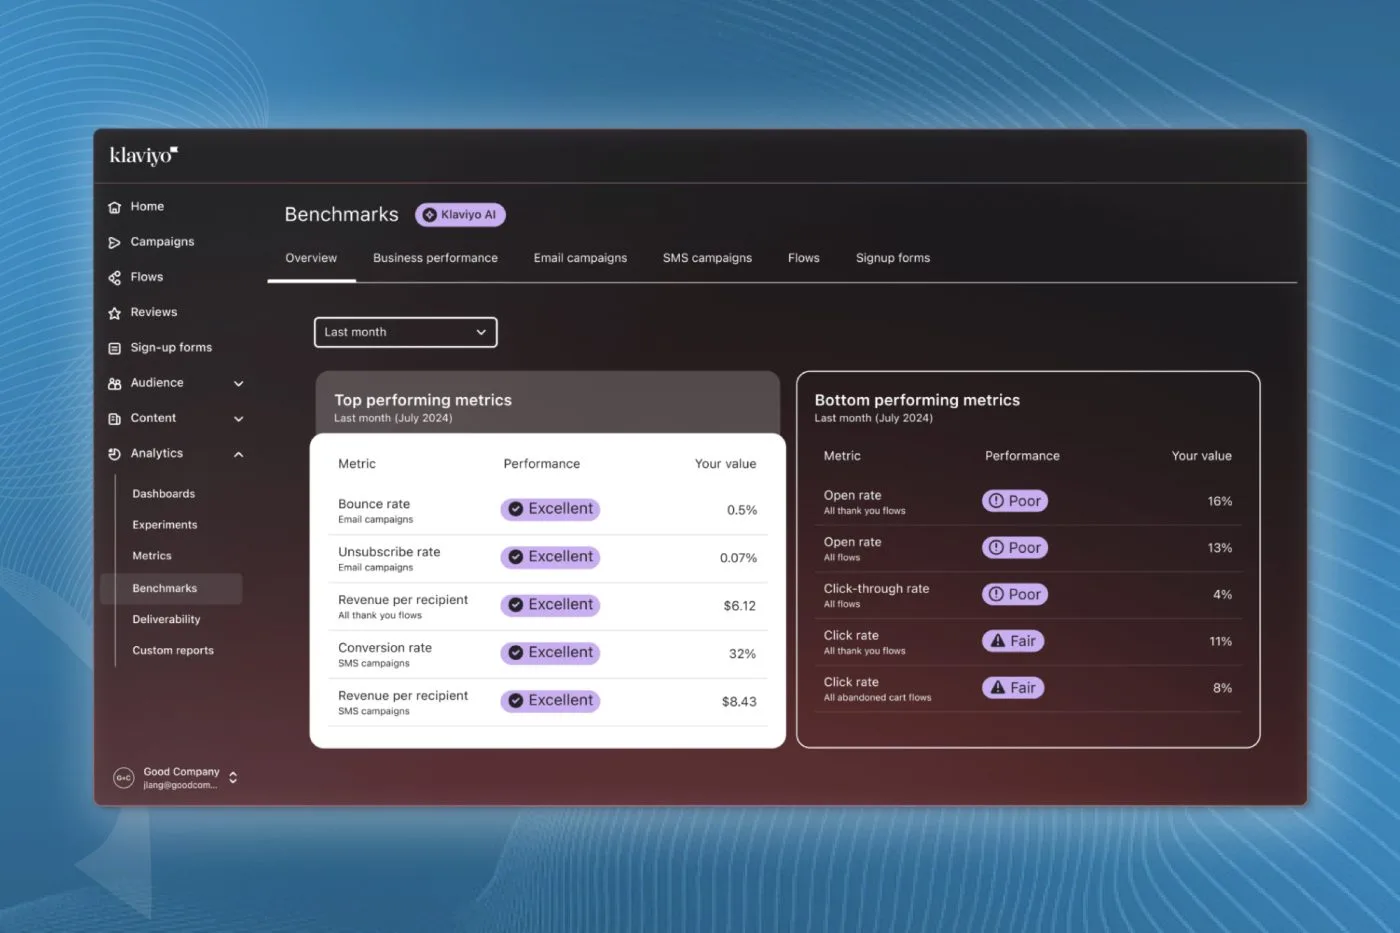
Inside Klaviyo, navigate to Campaigns to view performance at a glance. The snapshot view typically includes:
- Open rate
- Click rate
- Placed order rate
- Revenue
These metrics offer directional insight, but none of them alone defines account health or subject line effectiveness. They reflect a combination of:
- List quality
- Segmentation
- Deliverability reputation
- Offer strength
- Email content
Understanding that context is critical before making changes.
Understanding Open Rates (and What They Really Mean)
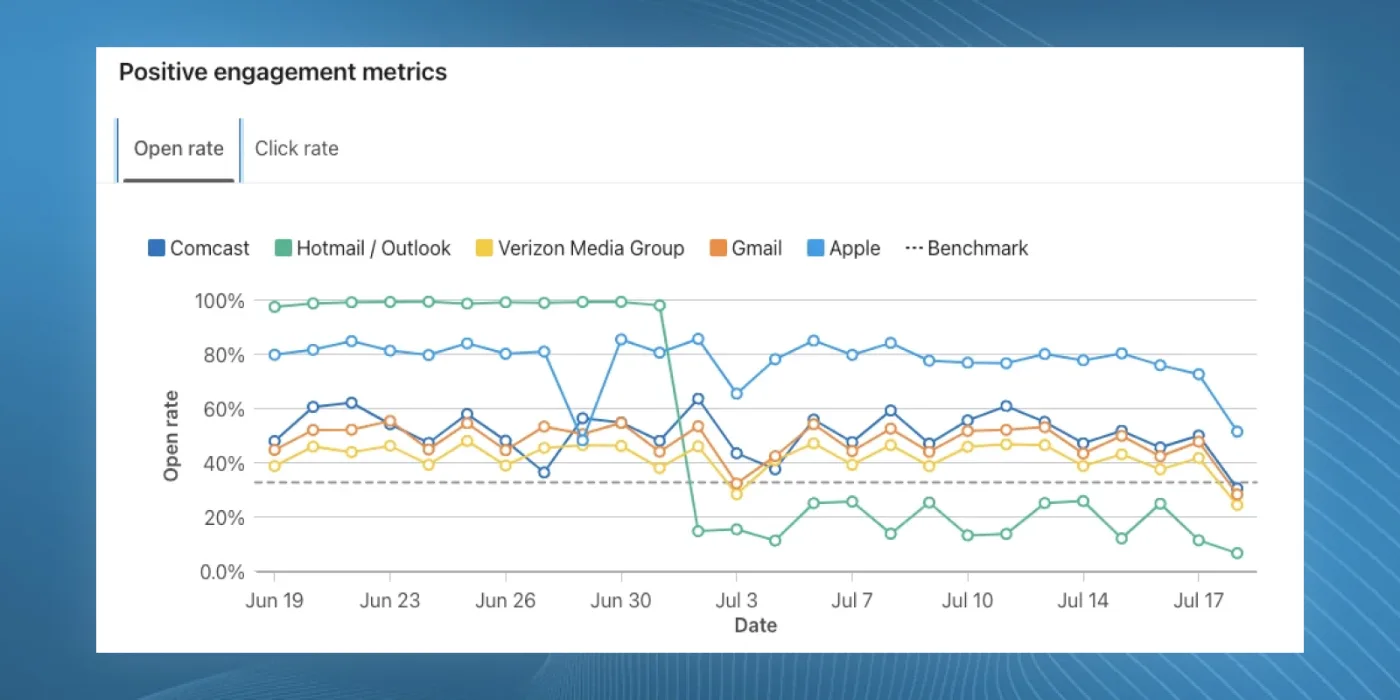
Open rate measures the percentage of recipients who opened your email. It does not represent how many people saw your message overall.
Segmentation can dramatically influence this number.
Sending to a highly engaged 30-day segment may produce extremely high open rates but reach fewer people overall. Sending to the full database may produce lower open rates but generate more total opens.
The objective is to find the balance between:
- How many people you reach
- How many actually engage
For many brands, a healthy open rate target is around 40% when sending to engaged segments. This level supports strong deliverability and inbox placement.
If open rates are lower than expected, tightening the engagement window can help. For example, shifting from a 120-day engaged segment to a 90-day engaged segment can improve engagement signals and sender reputation.
Subject Lines and Inbox Pattern Interrupts
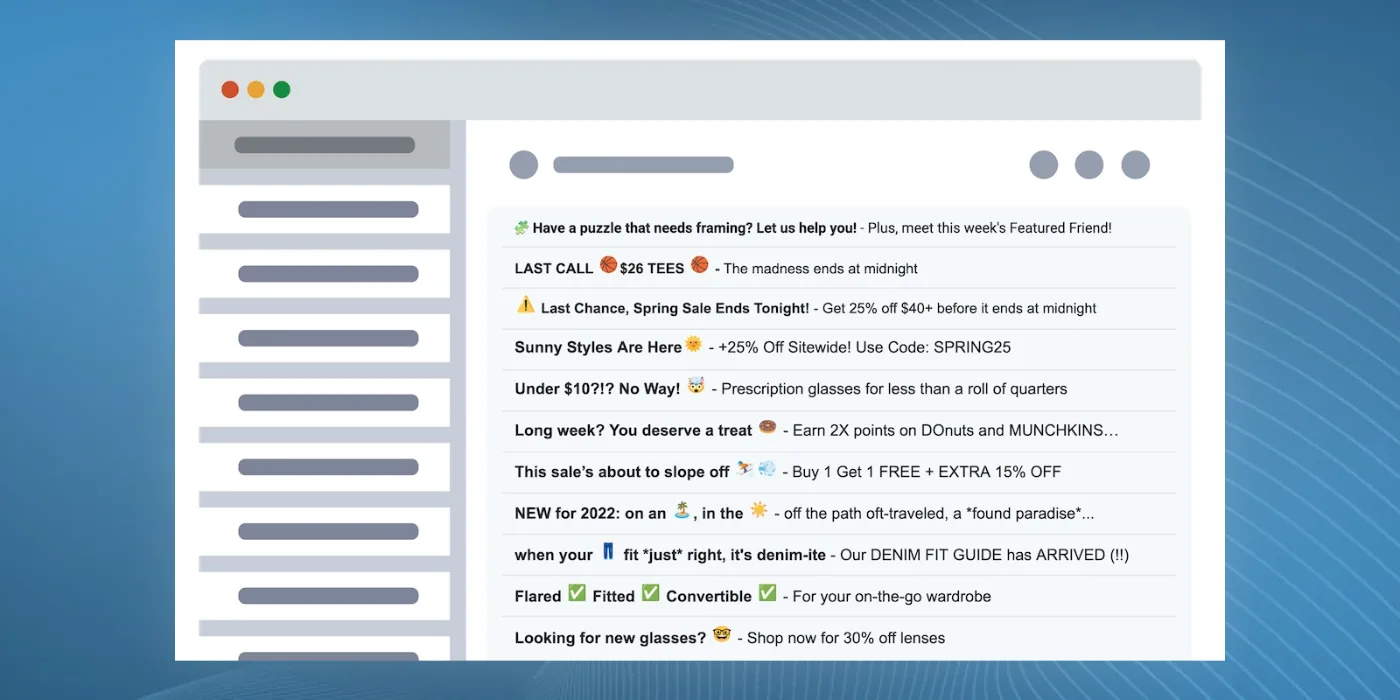
Subject lines influence open rates, but they are not the only factor.
Two consistent principles improve performance:
- Personalize when possible
- Lead with numbers when offering a discount
Leading with a number creates a pattern interrupt in the inbox. A subject line beginning with “25% Off” stands out more than one that hides the offer.
Click Rate: What It Tells You and How to Improve It
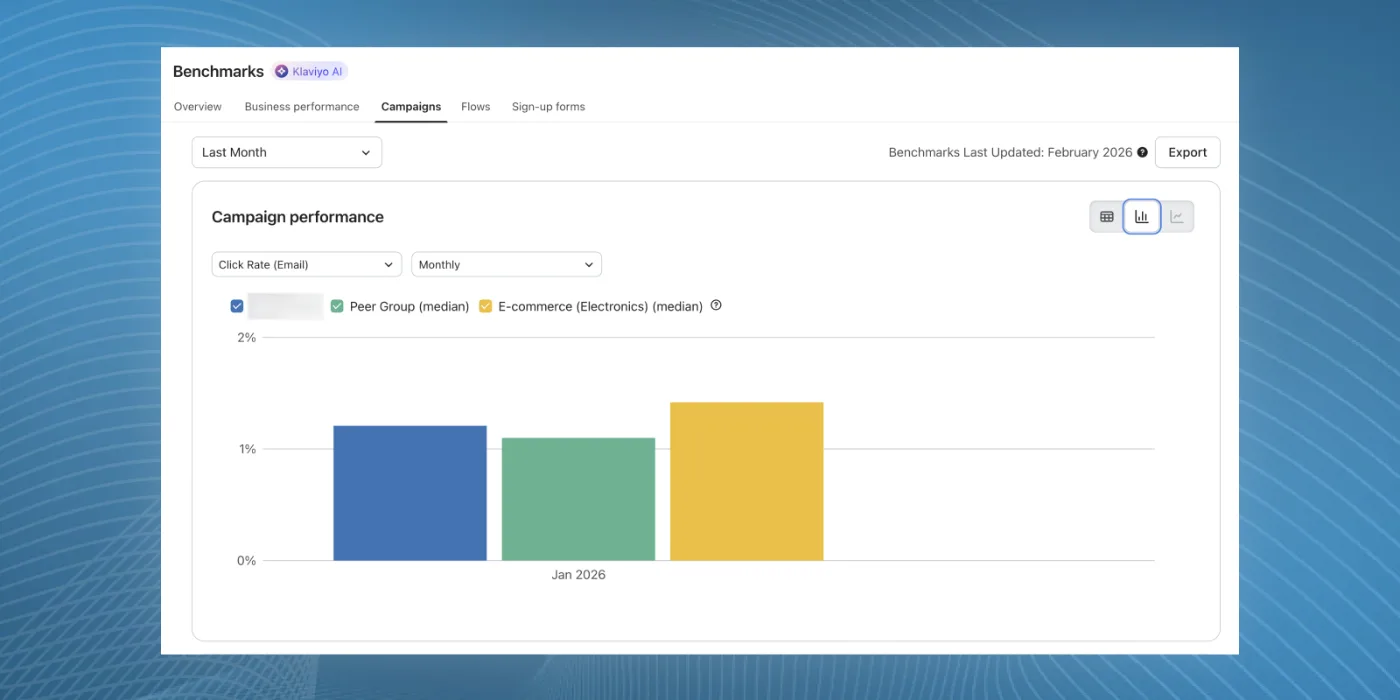
Click rate measures how many recipients clicked through after opening.
A healthy range for campaigns is typically 1, 2% or higher, though this varies by industry and audience.
Low click rates usually indicate one of three issues:
- The offer is not compelling
- The call-to-action is unclear or poorly placed
- The audience segment is not well aligned
When diagnosing click performance, review the email itself:
- Is the primary CTA visible without scrolling?
- Is the offer clearly stated near the top?
- Does the design guide the eye toward the action?
Buttons buried below the fold or unclear offers often reduce clicks. When the CTA is prominent and the design is clear, low clicks typically point to offer strength or audience quality.
For more strategies on increasing your open and click through rates, this is worth reviewing as well:
Placed Order Rate: Measuring Purchase Influence
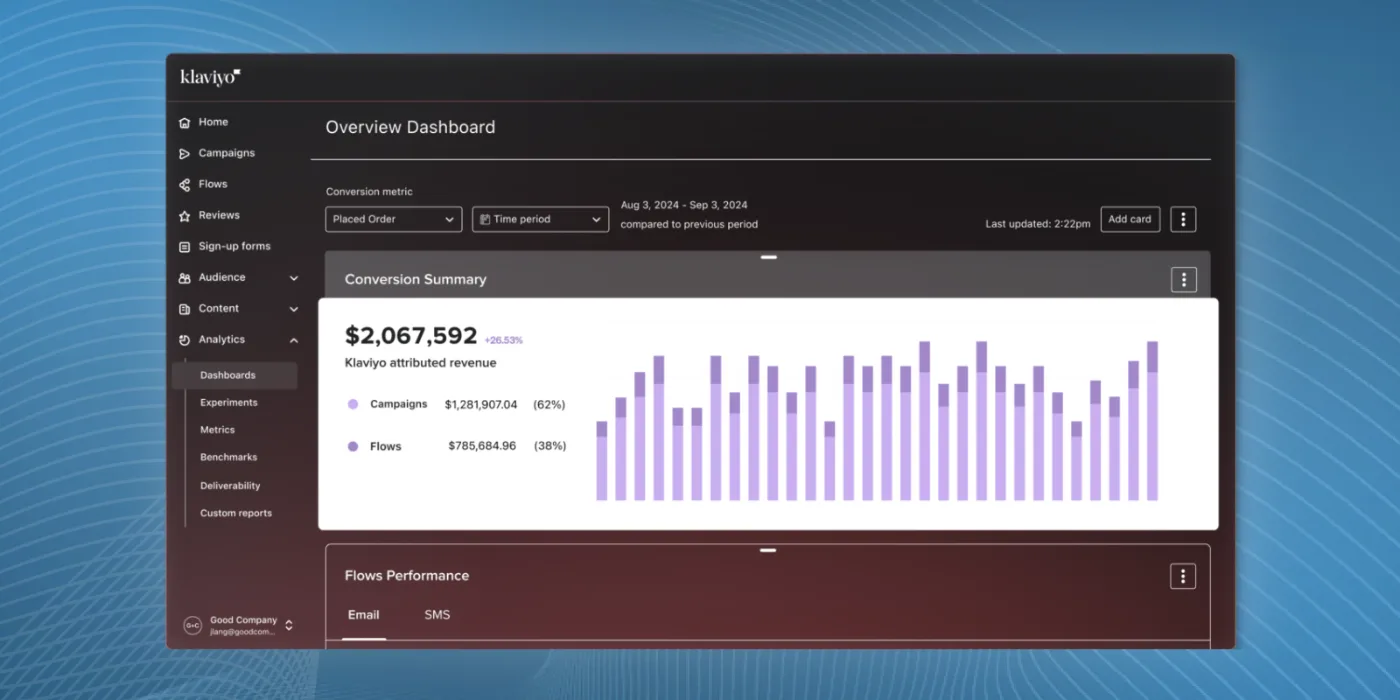
Placed order rate shows how many recipients completed a purchase after receiving the email. This metric varies widely based on campaign type, promotion, and audience.
It is most useful when comparing:
- Different offers
- Different products
- Split test variations
If testing whether 20% off performs better than 25% off, the placed order rate reveals which incentive drives more purchases. If the smaller discount performs similarly, margins are preserved without sacrificing revenue.
Website experience also plays a major role. A frictionless checkout and optimized product pages increase conversion rates beyond what email alone can influence.
Deliverability Metrics You Should Monitor
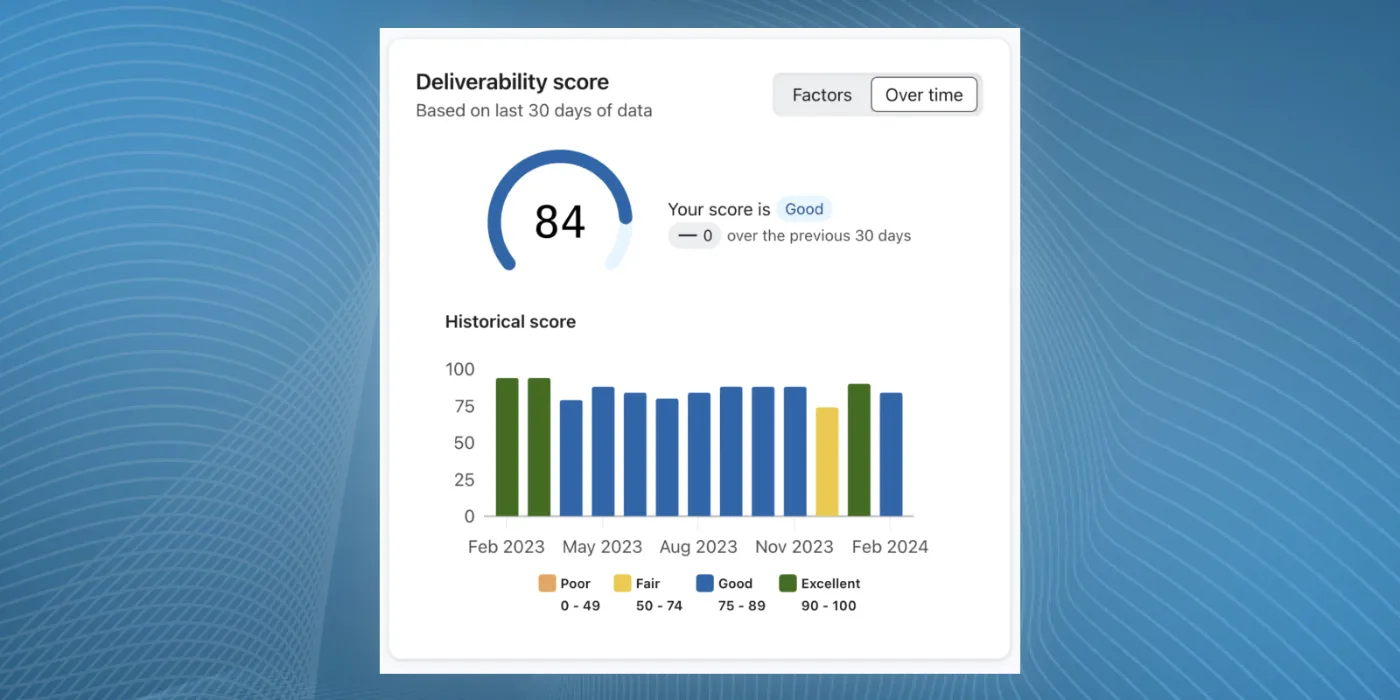
Deliverability determines whether your emails reach inboxes at all. Key metrics to watch include:
Delivery rate: If delivery rates are high (around 99% or higher), emails are successfully reaching inboxes.
Bounce rate: High bounce rates signal list hygiene problems. Excluding recipients who bounced within the past 30 days helps maintain sender reputation.
Unsubscribe rate: Unsubscribe rates above 1% indicate messaging, frequency, or targeting issues.
Spam complaint rate: Elevated spam complaints often occur when:
- Subscribers haven’t heard from the brand in a long time
- Large re-engagement sends target inactive contacts
- Contacts never explicitly opted in
Addressing these issues protects deliverability and long-term performance.
If you want to learn about other important email marketing metrics, you might also find this helpful:
Testing the Right Variables for Meaningful Improvements
Not all tests produce actionable insights. The goal is to test variables whose learnings can be applied consistently in future campaigns.
To Improve Open Rates
Test send time. Send time optimization produces repeatable insights about when audiences engage most.
We also have an article that goes over Subject Line best practices to help improve open rates. That article can be found below:
To Improve Click Rates
Test elements that influence engagement:
- Email design
- Layout and visual hierarchy
- Button placement
- Copy structure
For example, identifying a button style or layout that consistently improves clicks provides a repeatable improvement.
To Improve Placed Order Rates
Test factors tied directly to purchasing behavior:
- Promotional offers
- Featured products
- Messaging focus
These insights influence revenue directly and can be reused across campaigns.
How the Funnel Connects: Open → Click → Purchase
Each metric reflects a different stage of engagement:
- Subject line drives the open
- Design and copy drive the click
- Offer and website experience drive the purchase
Understanding this flow helps identify where performance breaks down.
A Note on Revenue per Recipient
Revenue per recipient can be misleading when used alone.
Sending to a larger segment may lower revenue per recipient while increasing total revenue. Expanding reach spreads revenue across more recipients, lowering the metric without harming overall performance.
Total revenue and engagement quality provide better context.
Final Thoughts
Klaviyo’s reporting dashboard is most valuable when metrics are viewed as signals rather than isolated scores.
Open rates reveal engagement health and deliverability signals. Click rates reflect message clarity and offer relevance. Placed order rates measure purchase motivation and on-site experience.
Focus on testing the variables that influence each stage of engagement. Improve them systematically, and campaign performance becomes predictable, repeatable, and scalable.